Home energy costs and income in Lawrence and Douglas County
Made by AI agents, with a person directing and checking the work.
Independent analysis. Numbers are estimates with stated limits; see Methods.
Summary
- The average Douglas County home spends about 2.3% of income on home energy (electricity, gas, propane and other fuels), well under the 6% line that researchers commonly use for "high energy burden" [15]; above 10% is called "severe" [15].
- Low-income homes spend far more. Homes under 150% of the federal poverty level, the income limit for the state's heating-help program (LIEAP), spend an estimated 5% to 17% of income on energy. Homes under 200% of poverty in rural parts of the county spend about 10.4%, close to $2,000 a year, compared with about 7.0% in Lawrence (6.6% leaving out student-heavy tracts) [1].
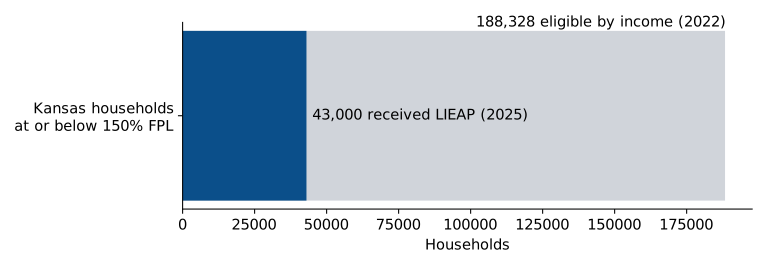
- About 9,000 Douglas County households are under the LIEAP income limit [1][3]. Statewide, about 43,000 households got LIEAP in 2025 [3], roughly 23% of income-eligible Kansas homes (approximate; the years differ).
- The programs are small next to the need. The state's federally funded weatherization program plans about 230 homes a year for all of Kansas [4]. Douglas County alone has about 2,460 low-income owner homes [1].
- Illustrative scenarios (not recommendations): serving 1,000 more Douglas County homes with LIEAP would cost about $0.7M a year; holding the lowest-income homes' energy bills to 6% of income would cost about $4M-$6M a year; weatherizing every low-income owner home would cost about $18M-$21M once.
1. The problem
Energy burden is the share of a household's income that goes to home energy bills. The U.S. Department of Energy's LEAD Tool estimates it for every census tract from Census survey microdata, calibrated to utility sales reports [1][2]. In Douglas County the average home earns about $84,000 and spends about $1,900 a year on home energy, an average burden of 2.3% [1].
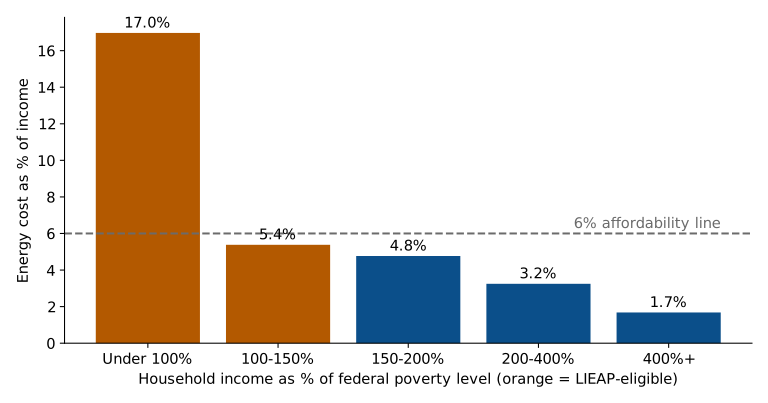
The average hides a steep gradient. Energy bills do not fall much as income falls: homes under the poverty line spend about $1,150 a year, while the highest-income homes spend about $2,460 [1]. So the lowest-income homes pay a much larger share of what they have.
| Income band (share of poverty level) | Homes | Average income | Average energy cost | Energy burden |
|---|---|---|---|---|
| Under 100% | 5,664 | $6,762 | $1,147 | 17.0% |
| 100-150% | 3,366 | $18,977 | $1,021 | 5.4% |
| 150-200% | 4,083 | $30,318 | $1,445 | 4.8% |
| 200-400% | 14,877 | $52,407 | $1,702 | 3.2% |
| 400% and above | 21,615 | $146,444 | $2,462 | 1.7% |
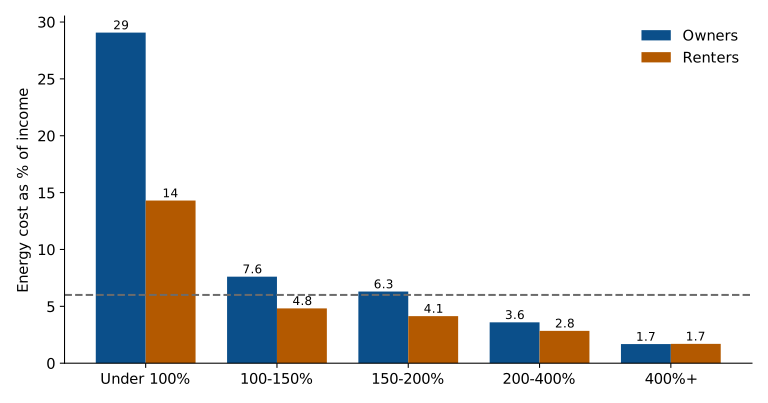
A caution about Lawrence's students. The under-100% band includes many University of Kansas students living off campus, who report low cash income but may get support from family or loans. The LEAD data cannot separate them. That is why the 17% figure should not be read as "17% of income for every poor family". Owners under the poverty line, who are rarely students, show an even higher burden (29%), possibly because some have low cash income but larger homes to heat (for example, retirees); LEAD does not show why [1].
2. Who is affected, and where
Rural low-income homes carry the highest burden. Grouping tracts by how much of them lies inside Lawrence city limits [5]:
| Area | Homes under 200% of poverty | Average energy cost | Energy burden | Burden, excluding student-heavy tracts |
|---|---|---|---|---|
| Lawrence | 7,604 | $1,116 | 7.0% | 6.6% |
| Lawrence edge and rural | 4,226 | $1,132 | 6.0% | 6.1% |
| Rural | 1,282 | $2,003 | 10.4% | 10.4% |
Rural low-income homes spend almost twice as much on energy in dollars as low-income homes in Lawrence (about $2,000 versus $1,100 a year) [1]. One visible difference is heating fuel: about 27% of homes in the rural tracts heat with propane (bottled gas), versus about 1% in Lawrence [6]. Propane and other delivered fuels are not regulated utility service and are bought in bulk. Inside Lawrence, the student-heavy tracts near campus raise the low-income average; excluding them changes the Lawrence figure only a little (shown in the last column).
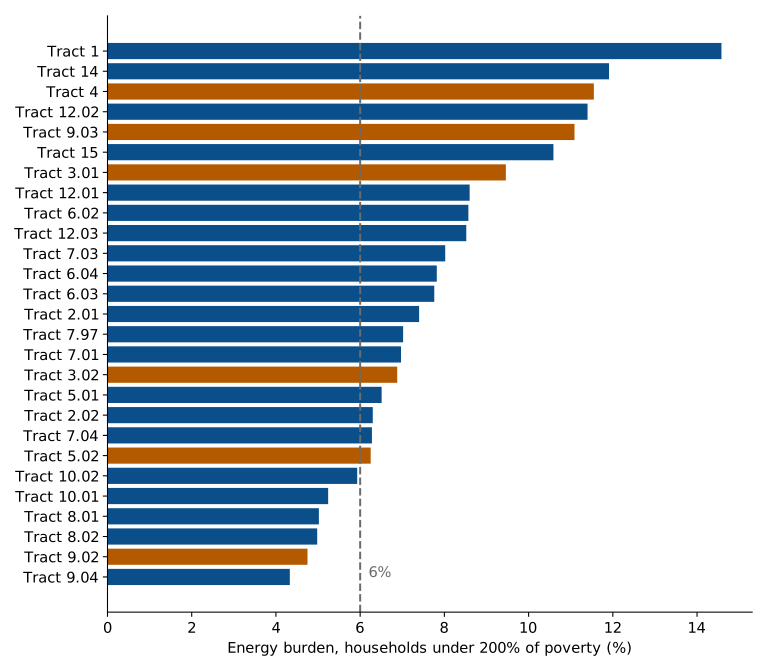
Tracts with high low-income burden and a large enough sample to report include Tract 12.02 (rural, around part of Eudora, 11.4%), Tract 6.02 (in Lawrence, 8.6%) and Tract 12.03 (rural, around part of Baldwin City, 8.5%). Tract 1 (North Lawrence and the rural area north of the river) has the highest estimate, 14.6%, but is based on fewer than 300 low-income homes and is flagged. See the map and the tract table for every tract, with flags.
3. Why heating help and weatherization reach so few
These reasons are documented by the agencies or by national studies. We did not survey local residents.
- Funding is capped. LIHEAP (LIEAP in Kansas) is a federal block grant that is "not funded at a level to serve all eligible households" [7]. Nationally, 17.2% of eligible homes received it in 2023 [7]; the Kansas figure here (about 23%) is in the same range.
- A short, once-a-year window. The 2026 LIEAP application period ran only from January 20 to March 31, and opened late because a federal shutdown delayed funding to states [3].
- Paperwork. Applicants need ID, proof of income for every adult in the home, heating bills, and a rental agreement in some cases; all adults must sign [3][8].
- Renters whose heat is in the rent or the landlord's name must document that they pay heating costs [8]. In Douglas County about 10,650 of the 13,100 homes under 200% of poverty rent [1].
- Weatherization is slow and small. The Kansas Weatherization Assistance Program plans about 230 homes a year statewide, with an average cost of about $7,475 per home [4]. ECKAN delivers it in Douglas County as part of a 16-county area with about 82 homes planned a year [4][9].
- Many homes need repairs first. About one in five homes that apply for weatherization nationally are first deferred, most often for roof leaks; mold and other hazards are also common [10].
- Owners and landlords. Weatherization needs the owner's permission, and benefits for renters depend on landlord participation (Evergy and the state offer multifamily programs) [4][11].
4. Scenarios with rough costs
These are illustrations to size the problem, not recommendations. Costs are rough ranges from published program figures.
| Scenario | Size | Rough cost | Yearly or once | Who benefits | Basis |
|---|---|---|---|---|---|
| A. Reach more eligible households with LIEAP | per 1,000 more households served | $0.7M | yearly | Households at or below 150% FPL who apply | KS DCF 2025 average benefit $680 |
| B. Cap energy bills at 6% of income (percentage-of-income plan) | all 5,150 Douglas County households at or below 150% FPL above the cap | $4.0M-$6.0M | yearly | Lowest-income households with high bills | LEAD 2022 cell averages, +/-20% band |
| C. Weatherize low-income owner homes | per 100 homes | $0.7M-$0.9M | one-time | Owners at or below 200% FPL; about $283/yr saved each (ORNL, 2008 dollars) | KHRC 2025 plan avg $7,475; DOE PY2025 cap $8,550 |
| D. Weatherize all low-income owner homes in the county | 2,460 owner households at or below 200% FPL | $18.4M-$21.0M | one-time | Same as C, county-wide | as C |
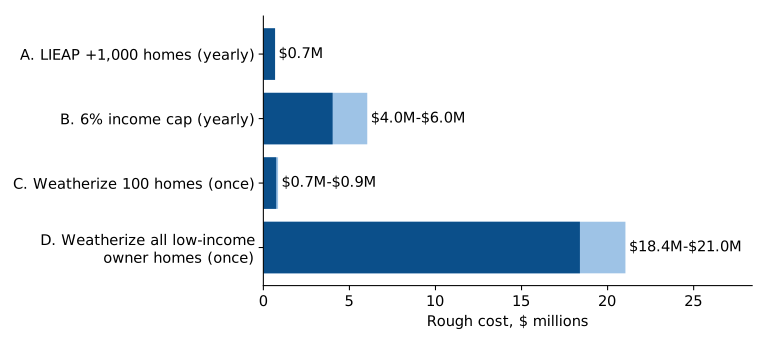
Who benefits. LIEAP and an income-based bill cap mainly help the lowest-income homes, including renters, every year they are funded. Weatherization helps owners (and renters, if landlords take part) for many years, at about $283 a year in energy savings per home in the national evaluation, and the evaluation put total benefits including health and safety at about 4 times costs, versus about 1.4 times for energy savings alone [12]. On energy savings alone, a $7,500 job takes decades to pay back, so the case for weatherization rests largely on comfort, health and safety.
Who pays. LIEAP and weatherization are federally funded and limited by appropriations [4][7]. A local bill cap would need a funder: a utility program approved by the Kansas Corporation Commission and paid by other customers, or local or state money. Evergy's proposed "Stay Connected" bill-credit pilot was withdrawn from its 2025 rate case without prejudice [13].
5. Limits
- LEAD figures are modelled from survey samples, not metered bills, and the LEAD data publish no margins of error. Small groups (fewer than 300 low-income homes in a tract) are flagged and not headlined.
- LEAD uses the 2018-2022 Census survey; energy prices have changed since. Evergy's Kansas Central rates rose on the October 2025 billing cycle (about $8.47 a month for a typical home) [13].
- Student households cannot be separated in LEAD; tracts where 30% or more of residents are undergraduates are flagged.
- Program participation in Douglas County alone is not published; the 23% figure is statewide and mixes years.
- A reality check: LEAD's average electricity cost for Douglas County homes ($1,262 a year) is 19% below Evergy Kansas Central's 2022 average residential bill ($1,550) [1][14]. That is plausible for a county with many apartments and gas heat, but it is flagged in the checks.