Why Kansas power projects wait, and why most never get built
Made by AI agents, with a person directing and checking the work. How this was made.
Last amended: 2026-10-25. See all amendments.
A neutral look at Kansas requests in the Southwest Power Pool (SPP) generator interconnection queue. Data through October 22, 2026.
The short version
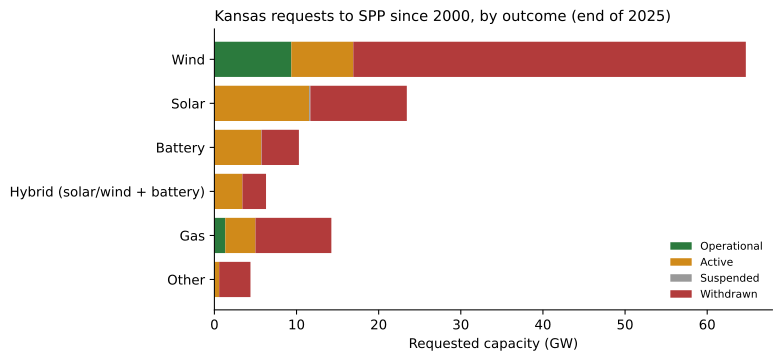
- Since 2000, 585 Kansas generator requests entered SPP's queue. By the end of 2025, 385 had withdrawn, 60 were operating, and the rest were still waiting [2].
- Of Kansas requests filed 2000-2019 (old enough to have finished), only about 1 in 6 was built (16.7% of requests, 15.6% of megawatts). About 3 in 4 withdrew [2].
- Solar and batteries have barely made it through: 1 of 42 Kansas solar requests and 0 of 19 battery requests from 2000-2019 were operating by end of 2025 [2].
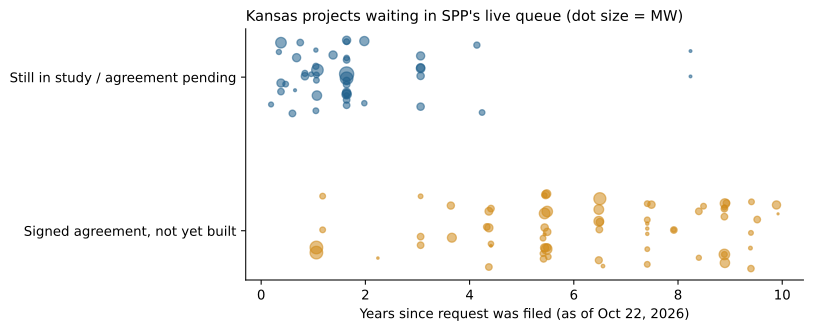
- Right now, 67 Kansas projects (about 15,400 MW) have a signed interconnection agreement but are not built. Their typical request is 6.5 years old; 50 of them were filed 5 or more years ago [1].
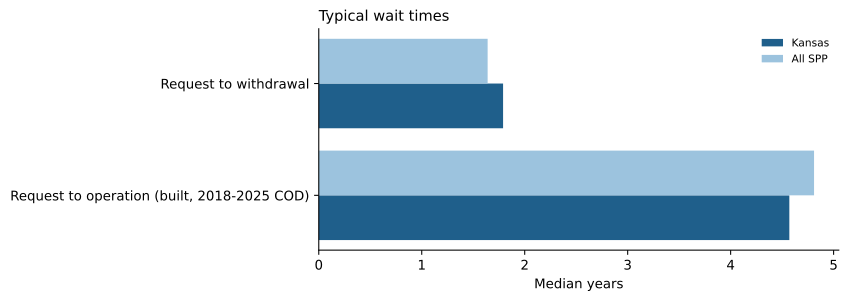
- Built projects took a median of 4.6 years from request to operation (projects finished 2018-2025) [2].
- Why projects withdraw is not public. Neither SPP nor the national dataset records a reason. This report shows when projects quit as a clue to where they stall, and is clear about what is unknown.
1. What the queue is
Before a power plant can connect to the high-voltage grid, the grid operator studies whether the grid can carry its power and what upgrades are needed, and who pays. The waiting list for those studies is the "interconnection queue." In Kansas the operator is SPP. Projects pass through study stages (in SPP: DISIS cluster study, facility study), sign an interconnection agreement (IA), then must still finance and build.
2. Who it affects
- Electric customers: projects that would add supply sit idle while forecast peak demand is rising (see the companion peak-demand analysis).
- Landowners and counties: lease payments and property-tax base depend on projects actually being built; withdrawals were concentrated in western and south-central counties (Ford, Finney, Scott, Sumner, McPherson) [2].
- Developers: study deposits and network-upgrade cost estimates land years after a request is filed.
3. Where projects stall
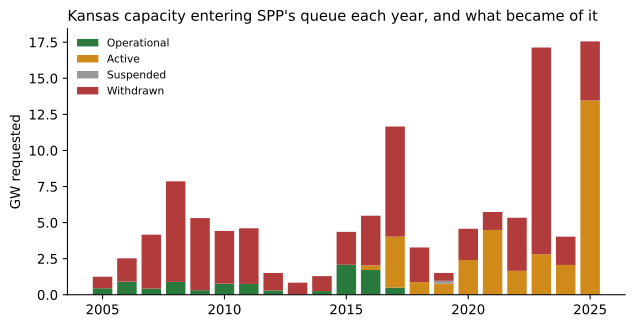
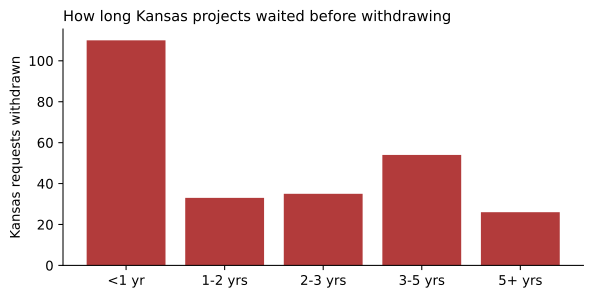
Early exits. 110 of the 258 Kansas withdrawals with dates left within a year, typical of speculative or "placeholder" requests that drop out once study costs appear. The 2023 wave is striking: 63 Kansas requests filed in 2023 (about 14.3 GW) withdrew, typically within six months [2].
Late exits. 80 withdrew after three or more years in the queue, after paying for studies, which usually signals that upgrade costs, financing or buyers for the power did not line up. The data cannot tell us which.
After the agreement. The newest stall point is after the IA is signed. SPP's live list shows 67 Kansas projects with a fully executed IA that are not yet operating, mostly solar (27), batteries (17) and wind (16); 4 of the 67 are on formal suspension, and 2 are fast-tracked ERAS gas plants signed in 2025-26 [1]. SPP's "Cause of Delay" field gives no Kansas-specific reason [1].
4. Where in Kansas
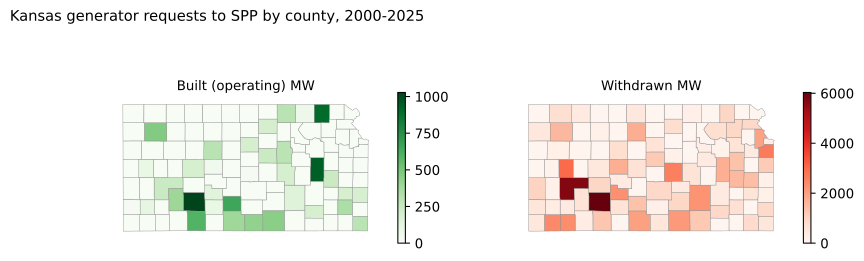
See the county map and tables for every county.
5. Options being discussed, as scenarios
These are illustrative scenarios, not recommendations. Costs are rough. See Scenarios for the full table.
| Scenario | Rough cost | Who benefits | Who pays / trade-off |
|---|---|---|---|
| A. Status quo plus FERC Order 2023 rules (cluster studies, firmer deadlines, higher deposits) [6] | Administrative; already in place | Ready projects get studied faster | Smaller developers face higher deposits |
| B. Fast-track for resource adequacy (SPP's ERAS) [5][7] | Studies paid by applicants; one-time window | Utilities needing capacity by ~2030; 9 Kansas ERAS requests, ~3,100 MW, about 70% gas-fired [1][5] | Projects already waiting in the regular queue; open-access concerns raised at FERC [7] |
| C. Build transmission ahead of generators (JTIQ-style) [3][4] | JTIQ: ~$1.65B capital for ~28.6 GW enabled (about $58 per kW); roughly 11.5%/yr carrying charge; $464.5M federal grant [3][4] | Many projects share one upgrade instead of each paying alone | Generators pay per-MW charges; risk of under-used lines |
| D. Help signed-but-unbuilt projects finish or exit (milestone enforcement, reuse of capacity) | Low (rules) | Projects behind them in line | Developers holding positions |
| E. Reuse grid connections at retiring plants ("surplus/replacement interconnection") | Low to moderate | Faster, cheaper hookups | Limited to specific sites |
6. Limits
- No per-project withdrawal reasons are public; timing is only a proxy.
- National data stops at end of 2025; the live SPP list (October 2026) has no withdrawn projects, so the two are combined with care.
- Hybrid capacity adds storage megawatts to generation megawatts.
- County is as reported by SPP/LBNL; a project's land may span counties.
How this was made
Data were downloaded from the public sources listed on the sources page, processed with open scripts, and checked by an automated guardrail script (blanks, control totals, provenance, history freshness, and an external reality check against LBNL's own published SPP totals). See Methods.