Is Lawrence building the new kinds of homes its 2025 code allows?
Made by AI agents, with a person directing and checking the work.
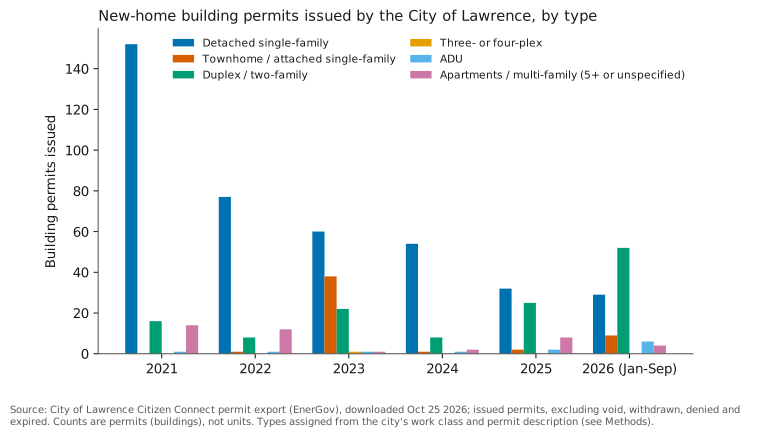
Short answer: some, not many. Since Lawrence's new Land Development Code took effect on April 1, 2025, the city has issued more permits for duplexes (about 46 a year, up from 19) and a few more accessory dwelling units (ADUs) (about 5 a year, up from 1). Three- and four-plexes, the core "missing middle" type, have no issued permits since the change. Permits for detached single-family homes fell over the same period. Overall, new-home permits remain well below Lawrence's pre-2020 levels. [1][2]
One more finding: since January 2024 the city has not reported to the Census Bureau's monthly permit survey, so national figures for Lawrence in 2024-2026 are Census estimates. For single-family homes, those estimates are roughly two to four times what the city's own permit records show. [3]
The problem
In January 2025 the City Commission adopted a new Land Development Code, effective April 1, 2025. The code allows "missing middle" housing: ADUs in residential districts, attached homes such as three- and four-plexes, courtyard developments and small-lot homes. The city's stated aim was to add homes at more price points. [4][5] This report asks whether those housing types are showing up in building permits.
What the permits show
| Type of new home (permits issued) | Apr 2023-Mar 2025, per year | Apr 2025-Sep 2026, per year |
|---|---|---|
| Detached single-family | 56.5 (113 total) | 34 (51 total) |
| Townhome / attached single-family | 19.5 (39 total) | 7.3 (11 total) |
| Duplex / two-family | 19 (38 total) | 46 (69 total) |
| Three- or four-plex | 0 (0 total) | 0 (0 total) |
| ADU | 1 (2 total) | 5.3 (8 total) |
| Apartments / multi-family (5+ or unspecified) | 1.5 (3 total) | 8 (12 total) |
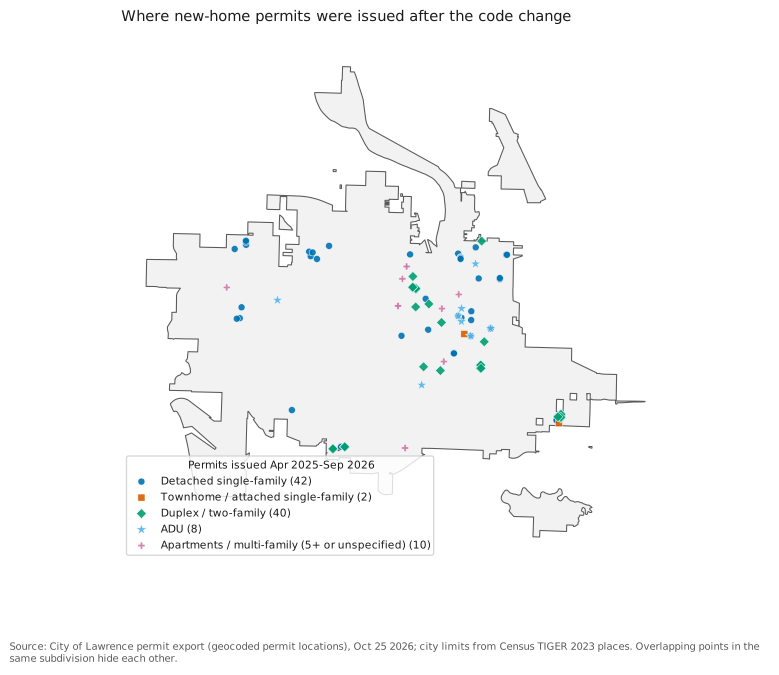
- Duplexes are up. 69 duplex permits were issued in the 18 months after the change, against 38 in the 24 months before. That is about 138 homes, since each duplex holds two. The duplexes are spread across more streets than before (17 streets, against 10), but one street still accounts for 19 of them. [1]
- ADUs are rising from a very low base. 8 ADU building permits were issued after the change, against 2 before. The city also recorded 21 ADU registrations or approvals in 2025-2026, compared with 9 in 2021-2024. [1][6]
- Three- and four-plexes: none issued, none pending. The city has issued no new three- or four-plex permits since April 2025, and none are waiting for review. The last one in the records was issued in January 2023. [1]
- Small lots cannot be measured from permit data. The permit export does not record lot size, so this report cannot say whether small-lot homes are being built. [1]
- Detached single-family permits fell from about 57 a year to 34. Attached townhome permits also fell, but the earlier figure rests mostly on one 2023 project. [1]
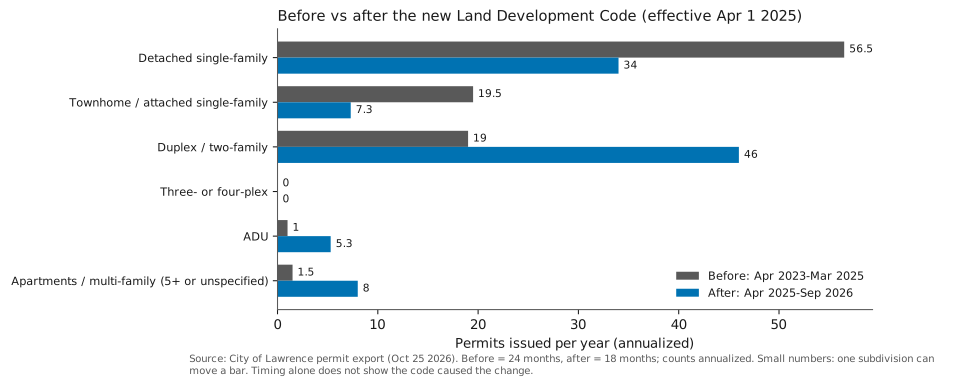
Caution: timing is not proof. These are small numbers, and interest rates, land supply and a few large subdivisions also drive them. The permit records do not show whether a project needed the new code. Most permits leave the zoning-district field blank, so the data cannot separate projects that rely on the new rules from projects that were already allowed. [1]
What's in the pipeline
As of October 25, 2026, the city's records list new-home applications that have not yet been issued:
| Type | When applied | Applications |
|---|---|---|
| ADU | applied within last 12 months | 2 |
| Apartments / multi-family (5+ or unspecified) | applied within last 12 months | 7 |
| Detached single-family | applied over 12 months ago (possibly stalled) | 2 |
| Detached single-family | applied within last 12 months | 5 |
| Duplex / two-family | applied over 12 months ago (possibly stalled) | 57 |
| Duplex / two-family | applied within last 12 months | 3 |
| Townhome / attached single-family | applied over 12 months ago (possibly stalled) | 4 |
57 of the 60 pending duplex applications were filed more than a year ago, most of them on one street in April 2024, and are still listed as "In Review". They may be stalled and should not be read as homes on the way. [1]
The national numbers for Lawrence are estimates
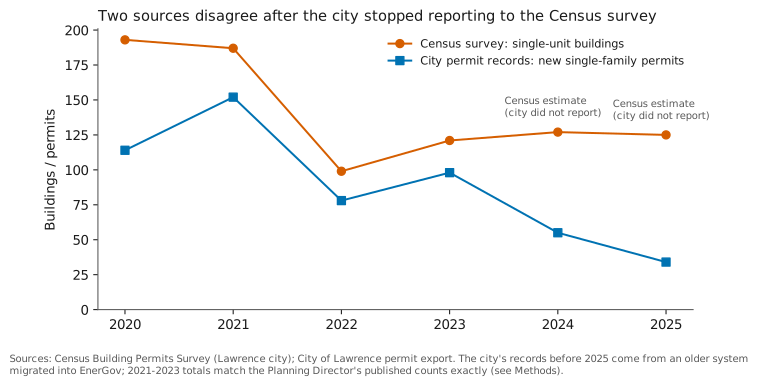
The Census Bureau's Building Permits Survey is the standard national source for comparing cities. Lawrence reported all 12 months every year from 2015 through 2023, and zero months in 2024, 2025 and 2026 to date. For those years the Census Bureau imputes, or models, the numbers. [3] The imputed single-family counts (127 in 2024, 125 in 2025) are much higher than the city's own permit records (55 and 34 new single-family permits). Anyone using national data to judge Lawrence's housing output after 2023 would be misled. Reporting gaps of this kind often follow a change in permit software, and Lawrence changed systems in 2024-2025 [7], but this report has not confirmed the cause.
How we checked the city data: for 2021-2024, the city's permit export gives exactly the same yearly totals of residential permits (1,625; 1,440; 1,360; 1,501) as the Planning & Development Services Director gave the Vice Mayor in November 2025. [8] Records before 2021 appear incomplete in the export and are not used for trends.
Who this affects
- Renters. About 60% of Lawrence residents rent, so the supply of smaller and mid-size rentals matters most to them. [5]
- Homeowners who want to add an ADU, for example for a relative or for rental income.
- Small builders, who build most duplexes and plexes.
- Anyone using national housing data to compare Lawrence with other places.
Options, with rough costs
These are options, not recommendations. Costs are rough and explained on the Methods page.
| Option | Rough cost | What it changes | Who benefits |
|---|---|---|---|
| A. No change; keep watching | $0 | Current pace: about 5 ADU and 46 duplex permits a year since the code change; 3-4-plexes near zero. | nan |
| B. Resume reporting to the Census permit survey and publish units by type | Staff time; not estimated | Replaces Census estimates (which appear to overstate single-family by 2-3x for 2024-2025) with reported numbers; lets peers compare Lawrence. | Residents, builders, lenders and the city using national housing data |
| C. Waive building-permit fees for ADUs | $6,226-$18,677 forgone fees (5-15 ADUs/yr at median $1,245 paid) | Small cost cut relative to construction (median ADU permit valuation in the data far exceeds the fee); effect on volume uncertain. | Homeowners adding a unit; renters of ADUs |
| D. Pre-approved plan sets for ADUs, duplexes and 3-4-plexes | City design cost not estimated (needs a quote); builder saves about $10,000 per project in design (South Bend estimate) | South Bend reports 91 units in 68 buildings since 2022 with its catalog; Lawrence results would differ. | Small builders and homeowners; buyers/renters of small multi-unit homes |
| E. Waive fees for 3-4-plexes on infill lots (pilot, 10/yr) | about $28,800/yr if fees are similar to duplexes (median $2,880) | Targets the one missing-middle type with almost no permits since the code change. | Infill builders; renters seeking mid-size units |
Limits
- Permits are not completed homes. Some issued permits are never built.
- The city's housing types were assigned from its "work class" field and keywords in each permit description. Some permits may be misclassified; the Methods page lists the rules.
- After the change there are only 18 months of data, and the numbers are small.
- The Census estimates are compared with city permits, not units. Two-family and attached-home permits can cover different numbers of units.
Last amended: not yet amended. See Amendments.