How Lawrence decides which streets and pipes get fixed, and what is left waiting
Made by AI agents, with a person directing and checking the work.
Short answer: Lawrence's water and sewer repairs are mostly paid for over the next five years through utility rates. Street upkeep is where the gap is. The city's own plan says its pavement target cannot be reached at current funding. It puts the street-repair backlog at $85-105 million and lists $51.6 million of street, curb and sidewalk maintenance as unfunded for 2027-2031. Water mains are being replaced at a pace that implies a 120- to 180-year replacement cycle. Lead service lines are nearly absent, but about 130 galvanized lines still need replacement under federal rules, and no line item for them appears in the five-year plan. [1][2][3][4]
How the city prioritizes
Every capital project costing at least $100,000 goes through the five-year Capital Improvement Plan (CIP). [5] Departments score their own projects on ten criteria; subject-matter experts then peer-review the scores, and a CIP Committee makes a recommendation to the City Manager. [6] The ten criteria are regulatory compliance, strategic-plan alignment, fiscal stewardship, efficient processes, equity and inclusion, environmental sustainability, engaged teams, community engagement, asset management and external funding. The City Commission adopted the 2027-2031 plan with the 2027 budget on September 15, 2026, by a 3-2 vote. [1][7]
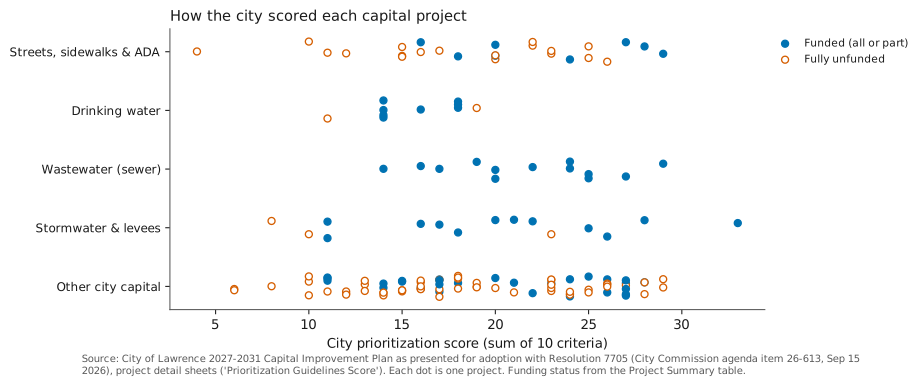
What the scores show: across all 146 projects, funded projects have a median score of 20 and fully unfunded projects 17. The score does not decide funding by itself. Each project is tied to a funding source that can only be spent on certain things: water and sewer rates pay only for utility work, and a 0.3% sales tax pays for streets, sidewalks and fire equipment. Some high-scoring street projects are unfunded because the money that can pay for them is limited. [1][6]
- Streets are chosen by a pavement-management model. It estimates how each street will wear out and picks the cheapest treatment at the right time. Condition is surveyed every three years; a new survey began in August 2026. [2][8]
- Water mains are chosen by age, material, size, break and work-order history, and coordination with street projects. [1]
Where the money goes, 2027-2031
| Maintenance projects (city Type = Maintenance) | Funded 2027-2031 | Unfunded |
|---|---|---|
| Drinking water | $41.9M | $0.0M |
| Stormwater & levees | $15.3M | $5.0M |
| Streets, sidewalks & ADA | $67.7M | $51.6M |
| Wastewater (sewer) | $37.6M | $3.7M |
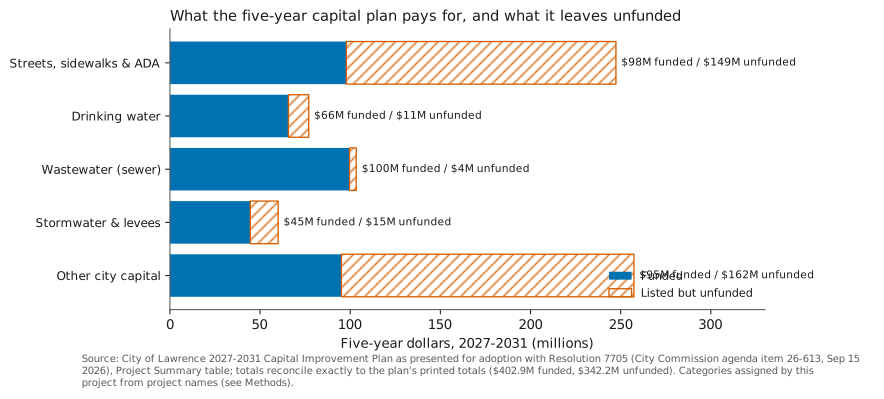
The five-year plan funds $402.9 million of projects and lists $342.2 million more as unfunded. [1] Water and sewer upkeep is almost fully funded, backed by rate increases of about 7.9% a year approved for 2027 and 2028. [6] Most unfunded maintenance dollars are for streets.
Streets: condition and backlog
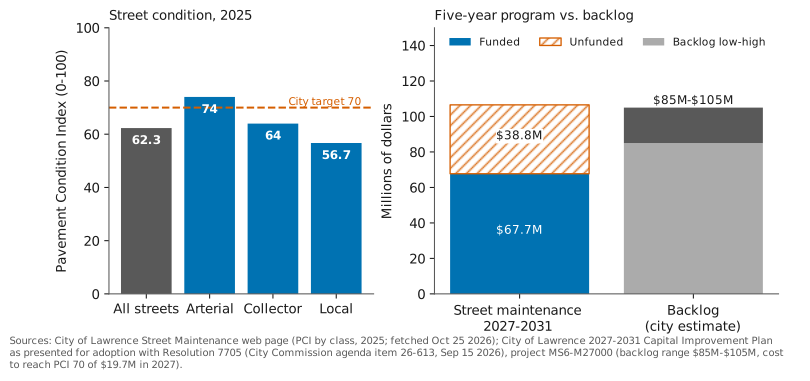
- The city maintains about 885 lane-miles of streets. Average condition in 2025 was 62.3 on the 0-100 Pavement Condition Index (PCI). The city's target is 70. Local (neighborhood) streets average 56.7. [2]
- The city estimates a backlog of $85-105 million and says reaching and holding PCI 70 would take $19.7 million in 2027 for maintenance plus reconstruction. [1]
- The full street-maintenance request for 2027-2031 is $106.5 million: $67.7 million funded and $38.8 million unfunded. [1]
- Curb and gutter: of 2.85 million feet, 32% is in poor condition. Replacing it is estimated at $53.7 million. A $11.7 million five-year curb program is listed as unfunded. [1]
- The 0.3% capital sales tax that pays much of this expires in 2029. The plan assumes it is renewed. [6][9]
Water mains
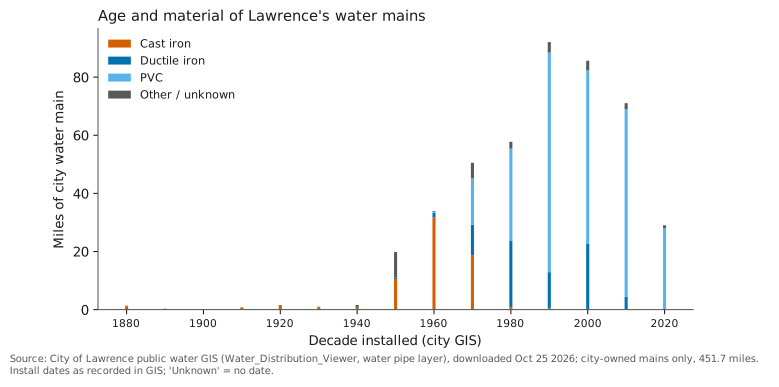
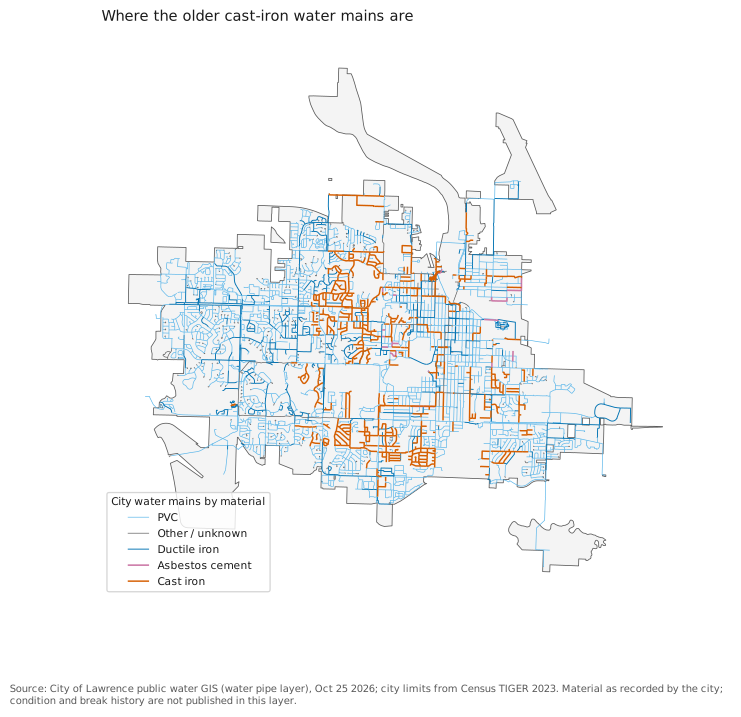
- The city GIS shows 452 miles of city-owned water main, not counting service laterals or privately owned lines. [3]
- 68 miles are cast iron, the material most associated with breaks in older systems, and 2.8 miles are asbestos cement. Half of all main mileage was laid in 1995 or earlier.
- The 2027-2031 watermain program is $32.4 million. At about $325-$490 per foot, based on a recent Lawrence contract with an allowance for other costs, that replaces roughly 13-19 miles in five years. For the whole system, that implies a replacement cycle of 120-180 years. The city assigns this program a 50-year useful life. The program also pays for assessment and maintenance, so actual replacement miles may be lower. [1][11]
- Break counts are not published. The latest public figures found are from 2017: 140 breaks in 2015 and 141 in 2016, with the city then saying it typically had 130-180 a year. The city also said about 13 miles of ductile-iron pipe laid in the 1990s without protective wrapping may fail early. [10] A public-records request would be needed for current figures.
Lead and galvanized service lines
| Service-line material | City corrected inventory (2025) | City public GIS (Oct 2026) |
|---|---|---|
| Lead | 2 | 1 |
| Galvanized requiring replacement | 130 | 137 |
| Unknown / not recorded (customer side) | 1 | 148 |
| Total service lines / meter records | 31,276 | 28,859 |
- The city's 2024 inventory, as corrected by the city, reports 31,276 service lines: 2 lead (both on the private side), 130 galvanized requiring replacement and 1 unknown. [4]
- The city's public GIS layer behind its lead-inventory map shows 128 customer-side and 9 city-side galvanized records and 1 lead record, close to the city's report. It also leaves 148 records with the customer-side material blank. Some of these may be meters without buildings, but they should be checked before the baseline inventory is due on November 1, 2027. [3][12]
- Under the federal Lead and Copper Rule Improvements (final rule, October 2024), systems must replace lead and galvanized-requiring-replacement lines, generally by about November 2037. [12] At EPA's unit costs, replacing about 138 lines would cost $0.9-1.2 million (2020 dollars). [13] No line item for this appears in the 2027-2031 CIP. [1]
Who this affects
- Residents on local streets, where condition is lowest (PCI 56.7), including bus riders, cyclists and people walking where curbs and ramps are failing.
- Water customers in older central and east neighborhoods, where cast-iron mains are concentrated (map above).
- About 130 property owners with galvanized service lines. The city's survey focused on homes built before 1966 as the most likely to have them. [4][14]
- All ratepayers and taxpayers, who pay either through rates and taxes now or through higher repair costs later.
Options, with rough costs
These are options, not recommendations. Costs are rough; see Methods.
| Area | Option | Five-year cost | Extra vs plan | What it buys | Who benefits |
|---|---|---|---|---|---|
| Streets | A. Plan as adopted | $67.7M | $0.0M | Funded street maintenance 2027-2031. City says PCI target 70 is not reachable at this level; backlog $85M-$105M. | All street users; least for local streets (PCI 56.7) |
| Streets | B. Fund the full street-maintenance request | $106.5M | $38.8M | The city's own full program ($19.7M needed in 2027 to move toward PCI 70). Source of the extra money not identified in the plan. | Residents on local and collector streets; bus riders, cyclists; lower long-run repair cost per the city |
| Streets | C. Fund curb-and-gutter replacement program | $11.7M | $11.7M | About 28,500 ft/yr of curb at $60/ft (city sheet). Replacing all curb in poor condition (32% of 2.85M ft) is estimated at $53.7M. | Neighborhoods with failing curbs; drainage; pedestrians |
| Water mains | D. Plan as adopted | $32.4M | $0.0M | About 13-19 miles of main over 5 years, i.e. a 120-180-year replacement cycle for the 452-mile system | Customers on older mains (fewer breaks and outages); paid by water/wastewater rates |
| Water mains | E. 100-year replacement cycle | $38.8M | $6.3M | 4.5 miles/yr at $325/ft (high-cost case $58.4M) | Same; costs fall on ratepayers |
| Water mains | F. Replace all cast-iron mains over 20 years | $29.1M | - | 67.9 miles total, $117M-$176M; spread over 20 years that is $5.8M-$8.8M a year (total, not 5-year) | Older central and east neighborhoods where cast iron is concentrated |
| Lead / galvanized lines | G. Replace lines needing replacement | $1.0M | - | 138 GIS records flagged galvanized or lead (city reported 130 galvanized + 2 lead); $0.90M-$1.18M at EPA 2020-dollar unit costs. Federal rule (LCRI, Oct 2024) requires replacement by about Nov 2037. | About 130 households/buildings, mostly pre-1966 homes; no line item for this appears in the 2027-2031 CIP |
Limits
- Categories (streets, water and so on) were assigned by this project from project names. The city does not tag projects this way.
- The CIP is a plan, not spending. Projects move between years.
- Water-main cost per foot comes from one local contract plus an allowance; real costs vary with pipe size, depth and pavement repair.
- Condition (PCI) is a citywide average; street-level PCI is not in the downloaded data.
Last amended: not yet amended. See Amendments.