Kansas peak power demand: how high, how often, and what it costs
Made by AI agents, with a person directing and checking the work. How this was made.
Last amended: 2026-10-25. See all amendments.
A neutral look at summer and winter peak electricity demand for Evergy's Kansas-area grid and the Southwest Power Pool (SPP). Hourly data through October 24, 2026.
The short version
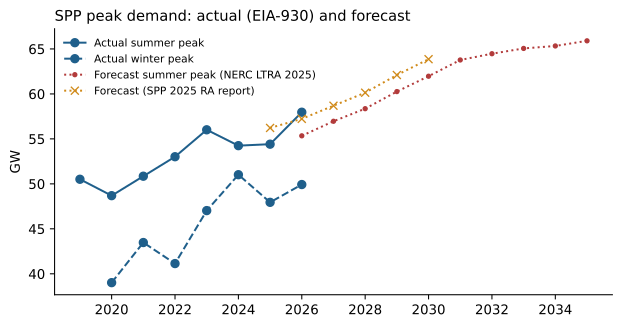
- SPP set a new all-time peak in summer 2026: about 58,000 MW on July 27, 2026, 3.5% above the 2023 record [1][8][9].
- Evergy's area (EIA subregions WR + KCPL) peaked at about 11,000 MW the same day, its highest summer since at least 2019 [2].
- Winter is catching up. SPP's January 2024 cold snap pushed winter demand to about 51,000 MW, 31% above the winter of 2020; Evergy's area reached about 9,200 MW [1][2].
- Forecasts point up. SPP-area summer peak is forecast to grow about 19% from 2026 to 2035 (NERC), and the 2026 actual already topped both NERC's and SPP's 2026 forecasts [4][5].
- A small number of hours drive the cost. In 2025 Evergy's area was within 10% of its annual peak for only 103 hours (1.2% of the year); the top ~950 MW was needed for fewer than 88 hours [2].
- Shifting peaks is worth real money, roughly. Moving 5% of Evergy's 2025 peak (about 515 MW, across 28 hours on 7 days) would avoid about 600 MW of new capacity, worth roughly $62-116 million a year before program costs [2][6][7].
1. Why peaks matter for bills
Utilities must own or buy enough capacity to meet the single highest hour, plus a planning reserve (SPP: 16% in summer 2026, 36% in winter 2026-27) [4]. Plants, lines and substations sized for the peak are paid for all year in rates even if they run only a few hours. That makes the peak, not average use, a major driver of grid costs.
2. Who it affects
- All customers pay for peak capacity through rates. In Kansas, 2024 retail sales were about 34% residential, 38% commercial and 28% industrial [3].
- Households without central air or with electric heat are most exposed to extreme-weather peaks; winter peaks now come from electric heating as well as gas-furnace fans and heat pumps.
- New large loads: SPP has received new load requests for data centers, pipelines, oil and gas, irrigation and industry, and NERC notes members' forecasts have been tracking below recent actual peaks [4].
3. Summer and winter peaks
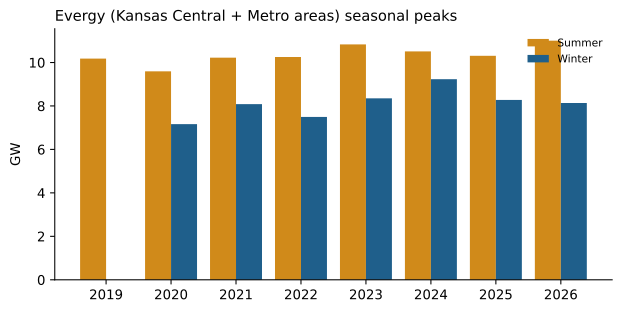
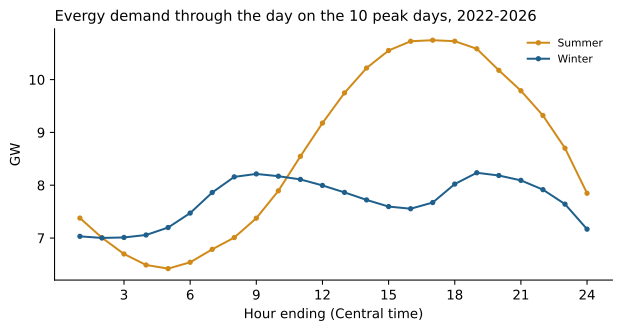
Summer still sets Evergy's annual peak, at 4-6 PM on hot weekdays. Winter peaks are flatter, with morning (7-9 AM) and evening (6-8 PM) humps; on the 10 coldest-weather peak days the evening winter hump averaged about 8,200 MW versus 10,700 MW on the hottest days [2].
4. Few hours, big costs
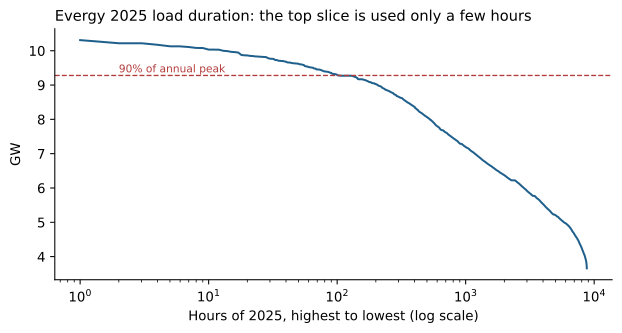
| Year | Evergy-area annual peak (MW) | Hours within 10% of peak | Hours within 5% | Load factor |
|---|---|---|---|---|
| 2023 | 10,832 | 64 | 27 | 51% |
| 2024 | 10,510 | 86 | 27 | 53% |
| 2025 | 10,309 | 103 | 28 | 55% |
Source: EIA-930 [2]; full table in the data downloads.
5. Demand-shift scenarios
Illustrative only; not recommendations. Base: 2025 hourly demand. Cost range = avoided new peaking capacity (with 16% reserve) at $103-$194 per kW-year [6][7].
| Evergy (KCPL+WR) | 1 | 103 | 3 | 1 | 120 | 12.30 | 23.20 |
| Evergy (KCPL+WR) | 3 | 309 | 12 | 4 | 359 | 37 | 69.70 |
| Evergy (KCPL+WR) | 5 | 515 | 28 | 7 | 598 | 61.60 | 116 |
| Evergy (KCPL+WR) | 10 | 1,031 | 103 | 20 | 1,196 | 123 | 232 |
| SPP | 1 | 544 | 7 | 4 | 631 | 65 | 123 |
| SPP | 3 | 1,632 | 29 | 7 | 1,894 | 195 | 368 |
| SPP | 5 | 2,721 | 54 | 12 | 3,156 | 325 | 613 |
| SPP | 10 | 5,441 | 176 | 31 | 6,312 | 650 | 1,226 |
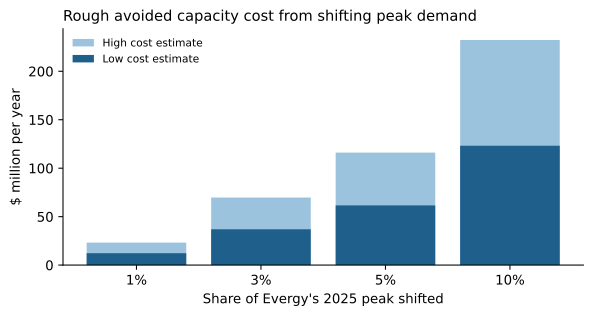
See Scenarios for how each could be done, rough costs and who benefits.
6. Limits
- "Evergy" here is two EIA-930 SPP subregions; they include Missouri load and some non-Evergy utilities. No public hourly Kansas-only series exists.
- SPP's footprint has grown; part of the SPP increase is new members, not just growth.
- Forecast and actual figures use different definitions (net of demand response).
- Scenario savings exclude program costs and assume a peaker is the avoided resource.
How this was made
Public data were downloaded, processed with open scripts and checked by an automated guardrail script, including an external reality check of our peak values against EIA's and SPP's published records. See Methods.